Case 01 - Enlarged Left Atrium
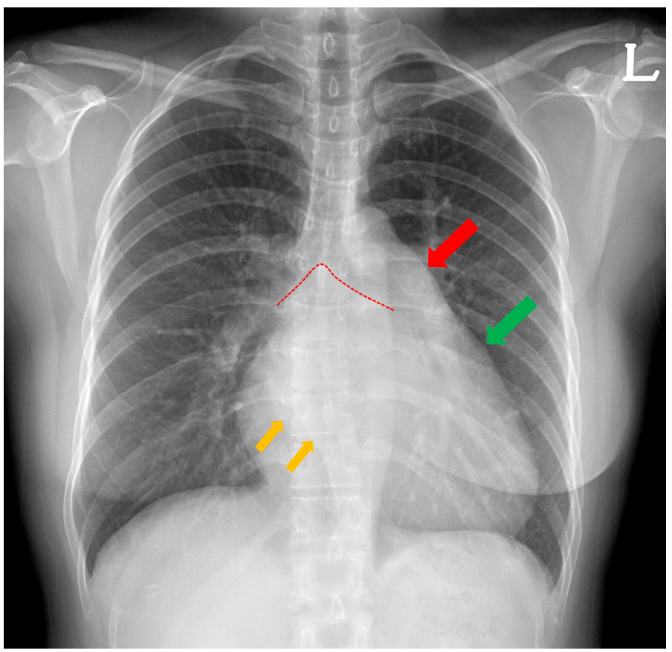
Let's examine the case of a 39-year-old woman diagnosed with severe mitral stenosis. While an expert familiar with chest X-rays and cardiovascular diseases would recognize the typical pattern of mitral stenosis, a less experienced physician might only identify cardiomegaly. In the chest X-ray, the pulmonary conus (indicated by the red arrow) and the left atrial appendage (indicated by the green arrow) show signs of enlargement. Additionally, as a result of left atrial enlargement, we can observe azygo-esophageal recess bulging (indicated by orange arrows) and carinal widening (indicated by the red dotted line). How can we objectively describe these findings? Let's consider the results of AI-based cardiovascular border (CB) analysis.
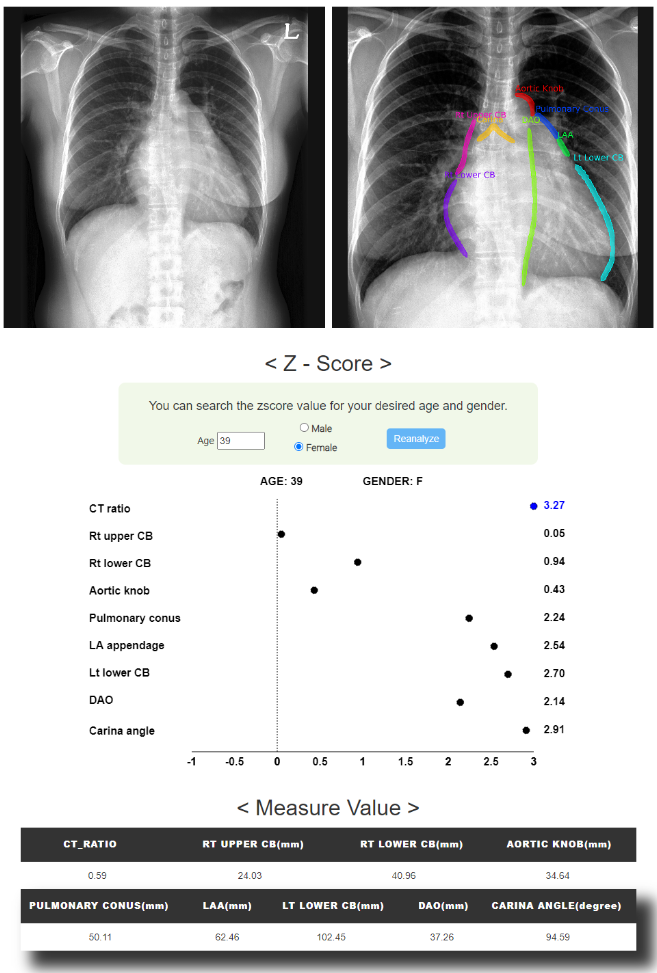
Upon examining the contours automatically drawn by the AI, we see that the left atrial appendage (LAA) is slightly shifted upwards but overall the contouring appears to be accurate.
When we look at the z-score plot calculated based on the norms for women in their 30s, several notable findings emerge.
The CT ratio is 0.59, which could be interpreted as borderline cardiomegaly in traditional terms.
However, the z-score is significantly elevated at 3.27. The z-scores for the left atrial appendage and the carinal angle, suggesting LA enlargement, are also considerably elevated at 2.54 and 2.91, respectively.
This was corroborated by transthoracic echocardiography, where the LA dimension was increased to 51mm.
Additionally, the z-score for the pulmonary conus is elevated at 2.24, and this patient displayed severe pulmonary hypertension associated with mitral stenosis.
These findings underscore the utility of AI-based cardiovascular border analysis in providing a more nuanced and objective assessment of complex cardiac conditions.
It adds quantitative depth to traditional approaches, helping to identify and validate subtle but clinically significant findings that might be overlooked by less experienced clinicians.
This patient underwent mitral valve (MV) replacement, and post-surgery outpatient X-ray analysis shows noteworthy improvements compared to the pre-operative state.
The z-score for the CT ratio improved significantly to 0.64. Other cardiovascular border metrics also show notable improvement when compared to the pre-surgery evaluations.
These findings highlight the effectiveness of the surgical intervention, not just in clinical terms but also as objectively quantified through AI-based cardiovascular border analysis.
This approach adds an additional layer of rigor to post-operative assessments and can serve as a valuable tool for tracking patient progress and treatment efficacy over time.

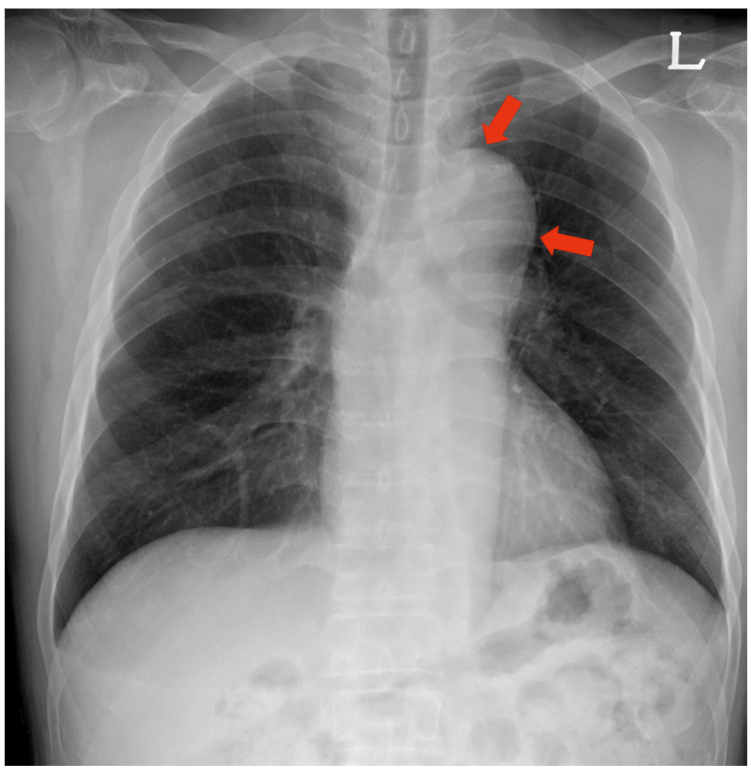
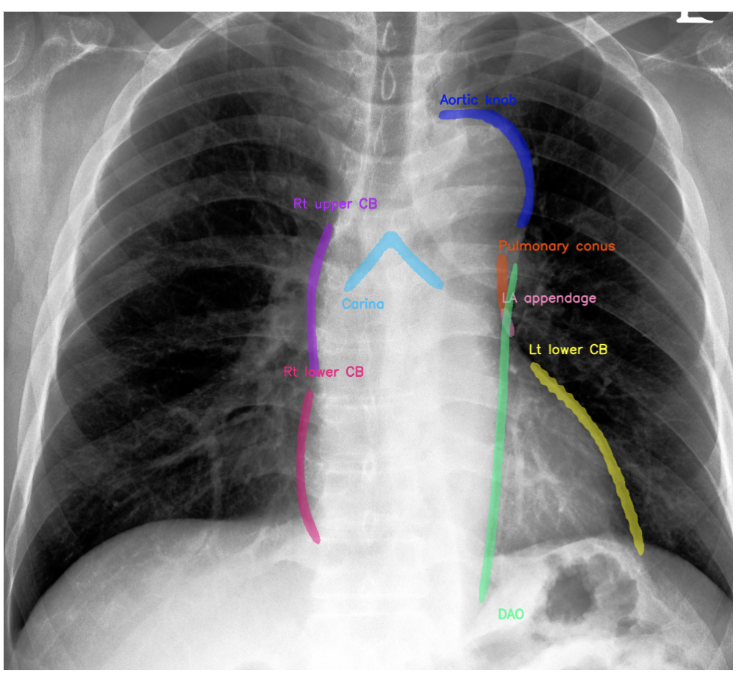
 Figure 3. Coronal CT Images show dissenting aneurysm involving descending thoracic aorta.
 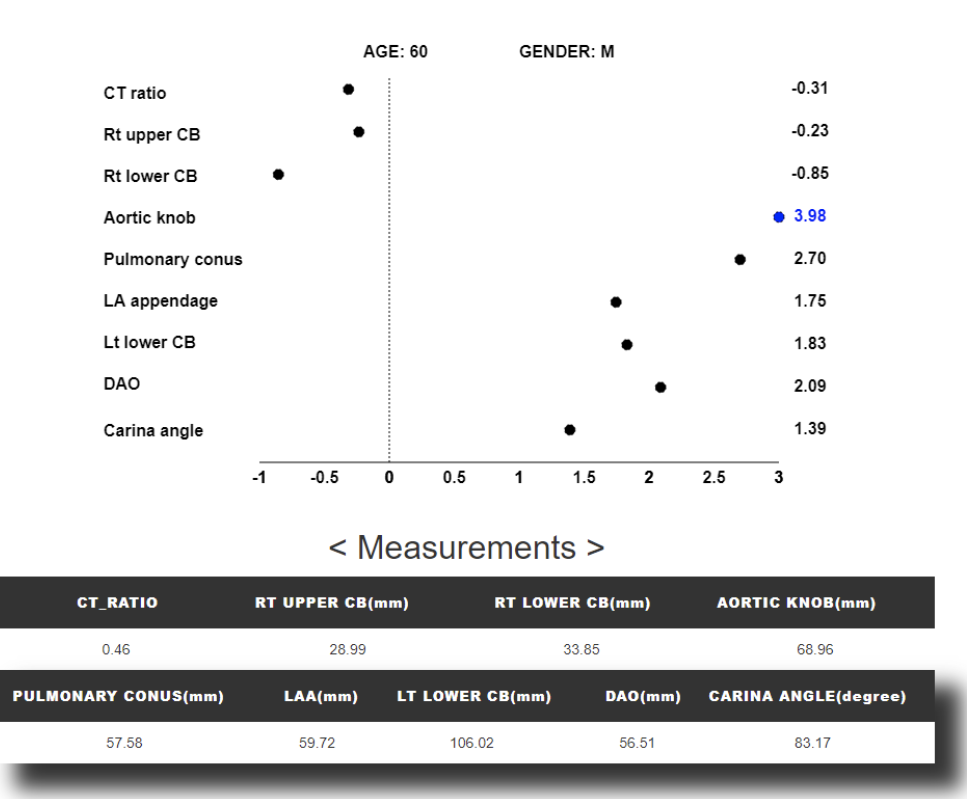 Figure 4.