Study Introduction
In chest X-rays, the cardiovascular border is one of the most distinct structures to discern with the naked eye.
This border can appear abnormal if the heart or major blood vessels are enlarged.
The Cardiothoracic ratio (CT ratio) is calculated by dividing the maximum diameter of the cardiac silhouette by the diameter of the thorax.
Historically, a CT ratio of 0.5 or 0.6 has been used as the upper limit for diagnosing cardiac enlargement (1). Let’s take a look at a case (Figure 1)
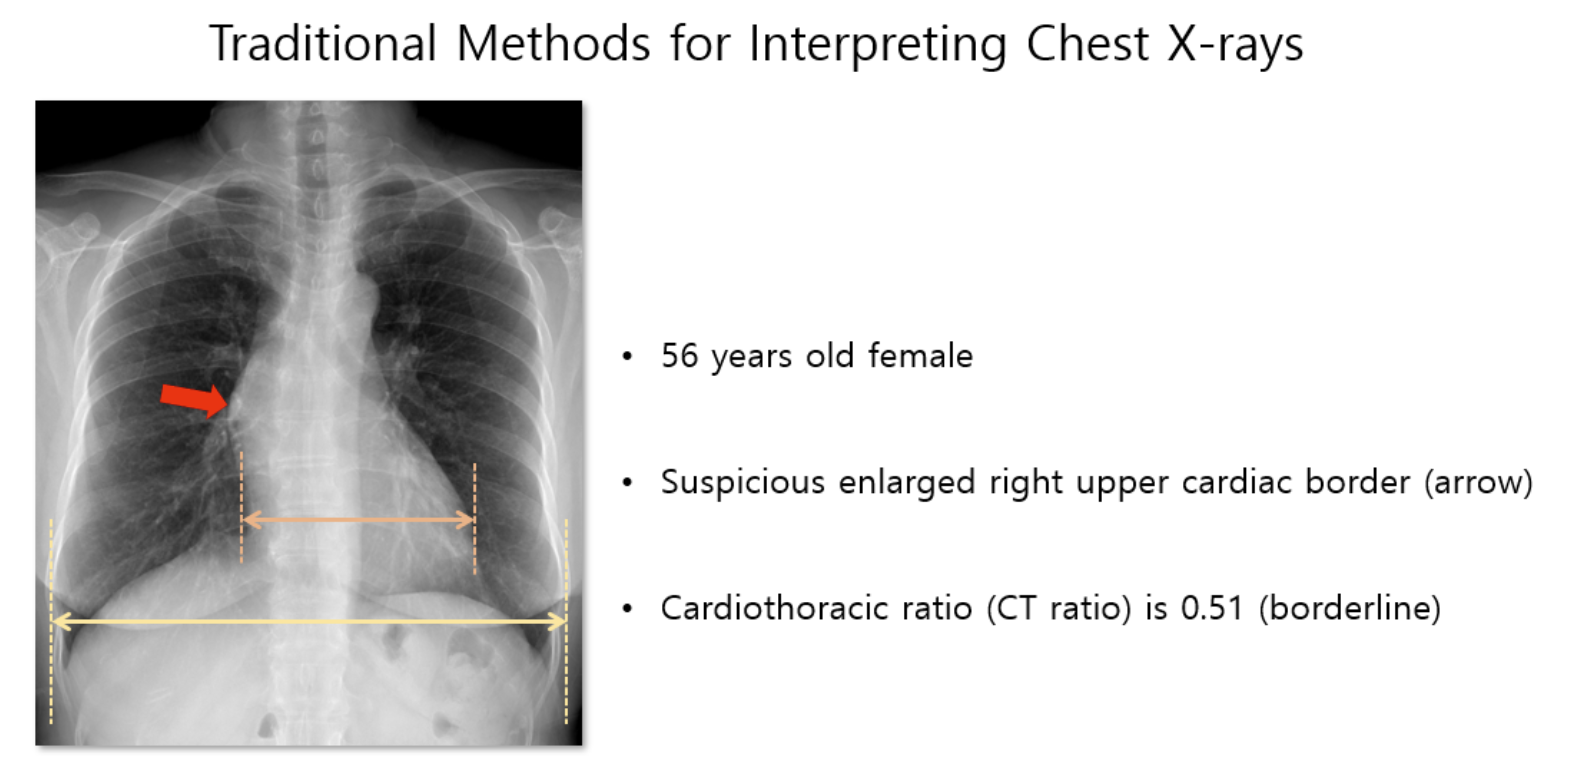 Figure 1
In this patient, the right upper cardiac border appears slightly prominent, as indicated by the arrow.
Inexperienced interpreters may easily overlook that this sign would indicate ascending aorta dilation.
The patient's CT ratio was borderline at 0.51. The CT ratio might not fully reflect changes in the cardiovascular border and can sometimes be a non-specific finding.
Moreover, the current standards of 0.5 or 0.6 are not specific to age/gender and are not based on large-scale observational studies.
What if artificial intelligence could delineate the cardiovascular border in chest X-rays at an expert level?
Then, not only the CT ratio but various indicators reflecting the changes in the cardiovascular border could be measured automatically, much like a blood test
(2). By integrating this technology with big data research, standard values from a healthy population could be established.
Furthermore, these cardiovascular border indicators could be extensively used for disease diagnosis, classification, and prognosis prediction. In this case, when evaluated using AI-based cardiovascular border analysis (Figure 2),
the width from the right upper cardiac border to the midline was measured at 35.7mm. This number is not intuitive and can be challenging to use. However, when converted to a z-score based on a normative cohort of approximately 70,000 healthy individuals in their 50s, the z-score for
this patient's right upper cardiac border (CB) could be calculated as 1.51. A z-score of 1.51 means that 93.45% of the same population group has a smaller right upper CB compared to this patient. Upon examining the z-score plot, it becomes evident that the patient's right upper CB is notably larger compared to other cardiovascular borders.
This could be an innovative approach that transforms our 'impression' from traditional methods—that the right upper CB appears slightly prominent—into objective 'data.' In reality,
this patient was confirmed to have an ascending aorta aneurysm associated with a bicuspid aortic valve, as evidenced by CT imaging (Figure 3).
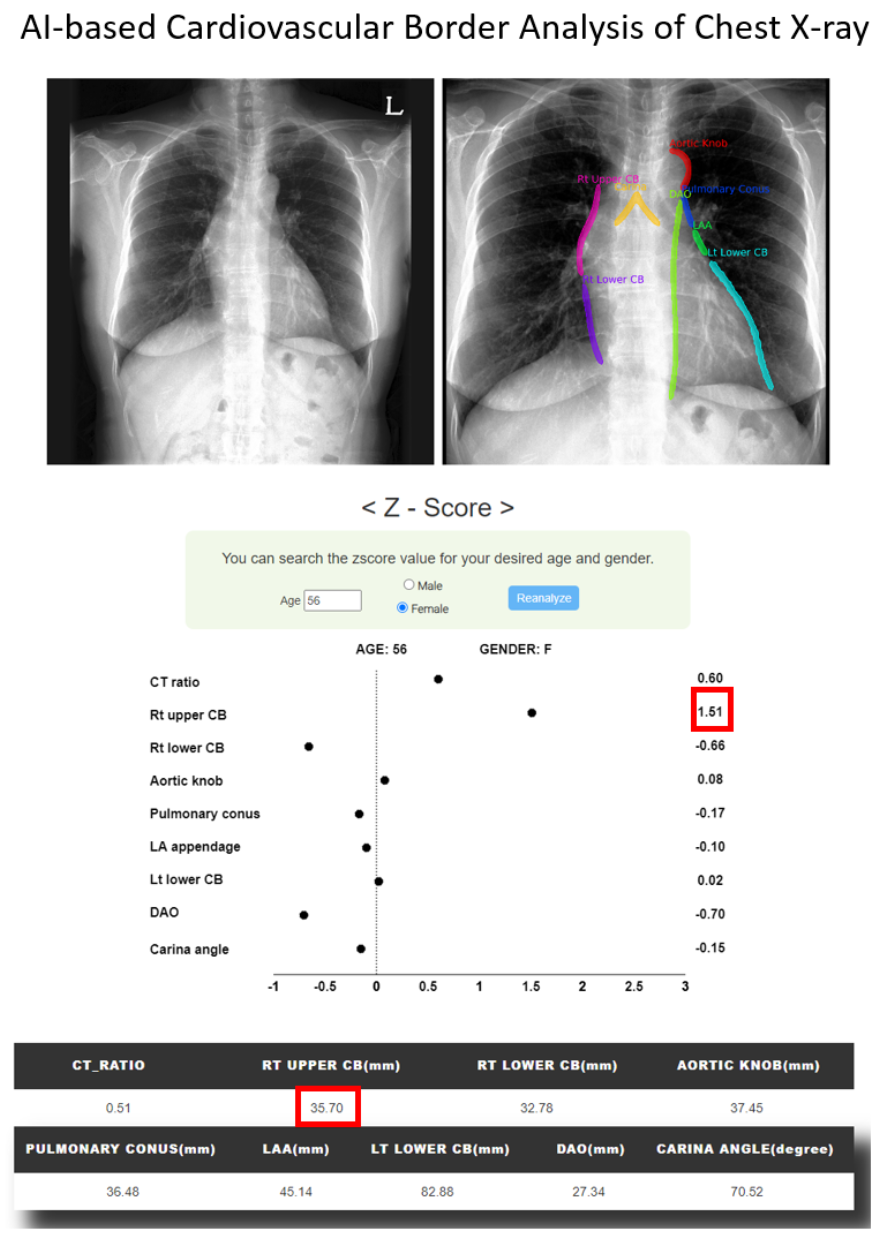 Figure 2
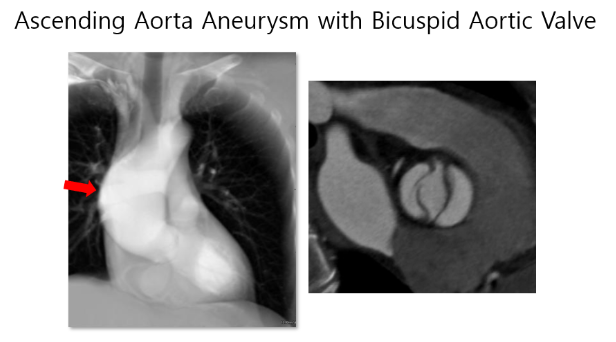 Figure 3
The ADC study (Automated Diagnosis of Cardiovascular Abnormality using Chest X-ray) aims to leverage AI-extracted cardiovascular border metrics from chest X-rays to contribute to a more accurate diagnosis of cardiovascular diseases.
Through this study, the cardiovascular border seen in chest X-rays will transition from the 'analog' domain to the 'digital' realm (Analog-Digital Conversion).